SiGMA, a media company, in collaboration with the Blask agency, has released the North America Market Report. The document covers July 2025 to June 2026.
The study compared top user interest in gaming brands with peak monthly revenue estimates across 11 regional countries. The results revealed a significant gap between these 2 metrics.
iGaming in North America


The Report Compared:
- Blask Index — digital interest in gaming brands
- Estimated revenue of tracked platforms
Where Interest Is Highest
Blask Index
- Haiti — 11.5m
- USA — 11.1m
- Mexico — 9.5m
- Canada — 8.4m
- El Salvador — 1.3m
- Panama — 1.2m
- Dominican Republic — 1.1m
- Costa Rica — 868k
- Honduras — 805k
- Guatemala — 490k


Where the Money Is
Estimated Revenue
- USA — $7.05bn
- Canada — $840.5m
- Mexico — $227.1m


The Biggest Contrasts
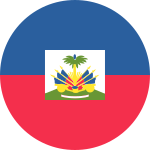
Haiti
- Blask Index: 11.46m
- Revenue: $2.48m
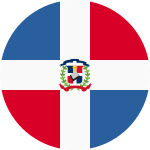
Dominican Republic
- Blask Index: 1.06m
- Revenue: $15.06m
Mexico vs Canada
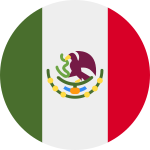
Mexico
- Population around 3.3× larger
- Higher Blask Index
- Almost 4× less revenue

Canada
- Blask Index — 8.4m
- Revenue — $840.5m
- More mature regulated environment
USA vs Canada: A Different Pattern
- The US population is approximately 8.2× Canada's
- Revenue ratio: ≈8.4 : 1


What Creates the Gap?
Potential Factors Include:
- regulation
- market maturity
- availability of legal products
- local industry structure
- platform coverage in the revenue model


What the Data Actually Means

Revenue Estimates Also:
- are not operators' reported financial results
- depend on which platforms are tracked
- are primarily an indication of market scale
Key Takeaways
- 23× — gap in digital interest
- ≈2,800× — gap in estimated revenue
- $7.05bn — USA, revenue leader
- 11.5m — Haiti, Blask Index leader
Casino Market’s team offers key insights from the review. We also provide detailed consultations on entering favourable jurisdictions and localising gambling projects.
Details of the Assessment Methodology
The Blask Index is a composite metric indicating the level of audience interest in iGaming brands. Its calculation factors in web search queries and other digital signals.
The study’s authors emphasise that the revenues presented are only estimates. While providing a general view of current market sizes, they do not reflect the actual GGR numbers of specific companies or jurisdictions.
Key Figures from the Analytical Report
The document names the following nations as leaders by the Blask Index:
- Haiti — 11.5 million.
- USA — 11.1 million.
- Mexico — 9.5 million.
- Canada — 8.4 million.
- El Salvador — 1.3 million.
- Panama — 1.2 million.
- Dominican Republic — 1.1 million.
- Costa Rica — 868,000.
- Honduras — 805,000.
- Guatemala — 490,000.
The picture changes when ranking by revenue volume: the United States takes first place by a wide margin, accounting for $7.05 billion. Next in line are Canada with $840.5 million and Mexico with $227.1 million. For the remaining jurisdictions on the list, the maximum figure reaches only $15.1 million (Dominican Republic).
Search Interest and Revenue: Regulatory Impact
The contrast between Haiti and licensed markets is particularly striking. With the highest index value, the Caribbean country’s estimated revenue was less than $2.5 million. By comparison, the Dominican Republic generated about $15.1 million, with its Blask metric 10+ times lower.
These indicators are far more comparable for the USA, Canada, and Mexico:
- The difference between the American population and its northern neighbour’s is x8.2.
- The revenue ratio between the 2 nations stands at approximately 8.4 to 1.
- In contrast, 133 million Mexicans are roughly x3.3 as many as Canadians.
- The 3rd-ranked country also has a higher index yet generates 4 times less GGR.
Regulatory differences may explain this disparity. Legal provincial platforms have operated in Canada since 2004, whereas Mexico’s gambling laws have not been changed since 1947. They lack specific rules for iGaming, leaving the sector in a grey area.
At the same time, these figures should not be taken as a direct reflection of the relationship between actual demand and GGR. The Blask indicator shows overall interest in gambling brands, while revenues are based on data from specific tracked platforms.
The Main Things About North America’s iGaming

The gap in web search values between the 1st and 10th positions is x23. Meanwhile, the difference in estimated GGR is nearly 2,800-fold. The report demonstrates that high audience demand does not, in itself, guarantee comparable financial results.
Several factors can influence final figures:
- regulatory specifics;
- the maturity of the gambling jurisdiction;
- the scope of platforms included in revenue calculations.
Feel free to contact us to stay abreast of industry trends and seize new growth opportunities with our team. We also offer comprehensive solutions for entering the gambling market in North America.

Have questions or want to order services?
Contact our consultants:
- e-mail: manager@casino-market.com
- feedback form.
Check the information used to contact us carefully. It is necessary for your safety.
Fraudsters can use contacts that look like ours to scam customers. Therefore, we ask you to enter only the addresses that are indicated on our official website.
Be careful! Our team is not responsible for the activities of persons using similar contact details.